Path of Exile Currency & Profit Calculator
The mapping journal in data/poe/currency-log.csv (25 maps, Affliction league) highlights the EV/time trade: Burial Chambers T16 Doctor target: 65c in, 3.2 min clear, 142c out → +77c, ~1,440c/hour; Cemetery Delirium: 48c in, 4.5 min, 165c out → +117c, ~1,560c/hour. Meanwhile a juicy 150c map that takes 12 minutes is only 750c/hour. The calculator mirrors those runs: input your map, investment, and clear time to see if your plan beats 1,000c/hr.
Two reproducible plays: (1) Budget Strand speed farm—20c investment, 2.8 min, ~74c return in the log; low variance, easy 1,500–1,600c/hr if you chain. (2) Doctor hunt—Burial T16 with Divination atlas nodes; EV jumps but only wins if you stay under ~4 minutes. Drop your own clear time into the calculator to see when div cards beat generic currency farms. Quick checklist: if clear time >5 min, scale back juicing; if currency/hour dips below your baseline, change map or atlas plan.
Expected value per action is the foundation. Each map is an independent trial covering currency, div cards, uniques, fragments, and influenced bases. EV per action = Σ(value × probability). The calculator ships community-verified drop rates for popular strats (Delirium, Expedition, Breach, Harbinger) and lets you override for league mechanics. By decoupling EV from time, you can test theorycrafts before spending scarabs and sextants.
GPH (chaos/hour) is where theory meets execution. A map with 120c EV at 3 minutes is 2,400c/hour; the same EV at 8 minutes is 900c/hour. The tool multiplies your measured clear time by EV to prevent the classic “over-juice and lose” trap where expensive scarabs lift EV by 30% but triple your time, cutting profit. Track 10–20 maps, feed the average, and let the model surface your best atlas path.
Atlas passives and scarabs are just levers in a break-even equation. Example: Harbinger scarab costs 15c and adds 35c EV; profitable only if the clear slows by <2.3 minutes. The calculator surfaces that break-even so you can keep or drop nodes without guesswork. Use the union probability widget for questions like “Doctor in 100 maps” or “95% chance for Apothecary in 160 City Squares,” so dry streaks stop feeling mysterious.
Model EV per action, GPH, union probability and cost/time trade-offs below. Adjust atlas passives, scarab investments, and pack size to find your optimal farming strategy. Share your setup with friends or export data for offline analysis.
Data Snapshot – PoE Mapping Journal
Our EV defaults reference the mapping journal stored at data/poe/currency-log.csv. Each entry records the map, investment cost, atlas passive focus, clear time, and currency returned. The excerpt below mirrors the batch used for the Affliction league patch.
date,map,investment,atlasPlan,clearMin,lootValue,profit,notes
2025-04-05,Burial Chambers (T16),65c,Divination,3.2,142c,77c,"Doctor target"
2025-04-05,Cemetery (T16),48c,Delirium,4.5,165c,117c,"Orbs + fossils"
2025-04-06,Crimson Temple (T14),32c,Expedition,5.0,120c,88c,"Rogue's markers"
2025-04-06,City Square (T16),55c,Harbinger,3.6,138c,83c,"Fracturing shards"
2025-04-07,Strand (T13),20c,Legion,2.8,74c,54c,"Speed farm baseline"
Full logs—with scarab breakdowns and chaos-per-hour normalization—are available in the repo and Airtable linked from Methodology.

Model EV per action, GPH, union probability and cost/time trade-offs. Share your setup with friends.
Calculator
How the PoE Currency Calculator Works (Expected Value, Drop Rates & Prices)
The model separates EV per action from time and merges them into GPH. Inputs include map tier/layout, pack size, density, scarabs/sextants, atlas passives, price source or overrides, and your route time. This PoE currency calculator helps optimize your farming strategy by showing exactly how each modifier affects your chaos orb per hour (c/h) returns.
EV per action formula
- EV(action) = Σ (drop_i_value × p_i)
- EV/map = Σ EV(action) + Σ guaranteed rewards − map cost
- GPH = EV/map ÷ map time (or EV/action × actions/hour − costs/hour)
See Glossary: Expected value · Weighted average.
Map templates & repeatable loops
Build repeatable mapping loops by tracking your clear speed, pack density, and drop rates across multiple runs. The calculator lets you model different map combinations and investment levels to find your optimal farming route for maximum currency profit in Path of Exile.
Movement & downtime accounting
Include portal time, stash trips, and trading windows in your time-per-map estimate for accurate GPH calculations. Even small efficiency gains add up over hundreds of maps.
Share & compare setups
Use shareable URLs to compare different atlas passive tree configurations, scarab combinations, and pack size strategies with friends or guildmates.
Mapping Profit: EV vs GPH — Time Efficiency for PoE Currency Farming
Faster loops often beat paper-high EV if the extra EV comes with heavy time penalties. Benchmark using actions/hour, not only per-map value.

Speed vs EV trade-off (GPH optimization)
A lean map with 80% of the EV but only 50% of the time will often outperform a juiced map in terms of chaos per hour. The key is finding the sweet spot where your setup maximizes GPH (c/h) rather than just EV/map.
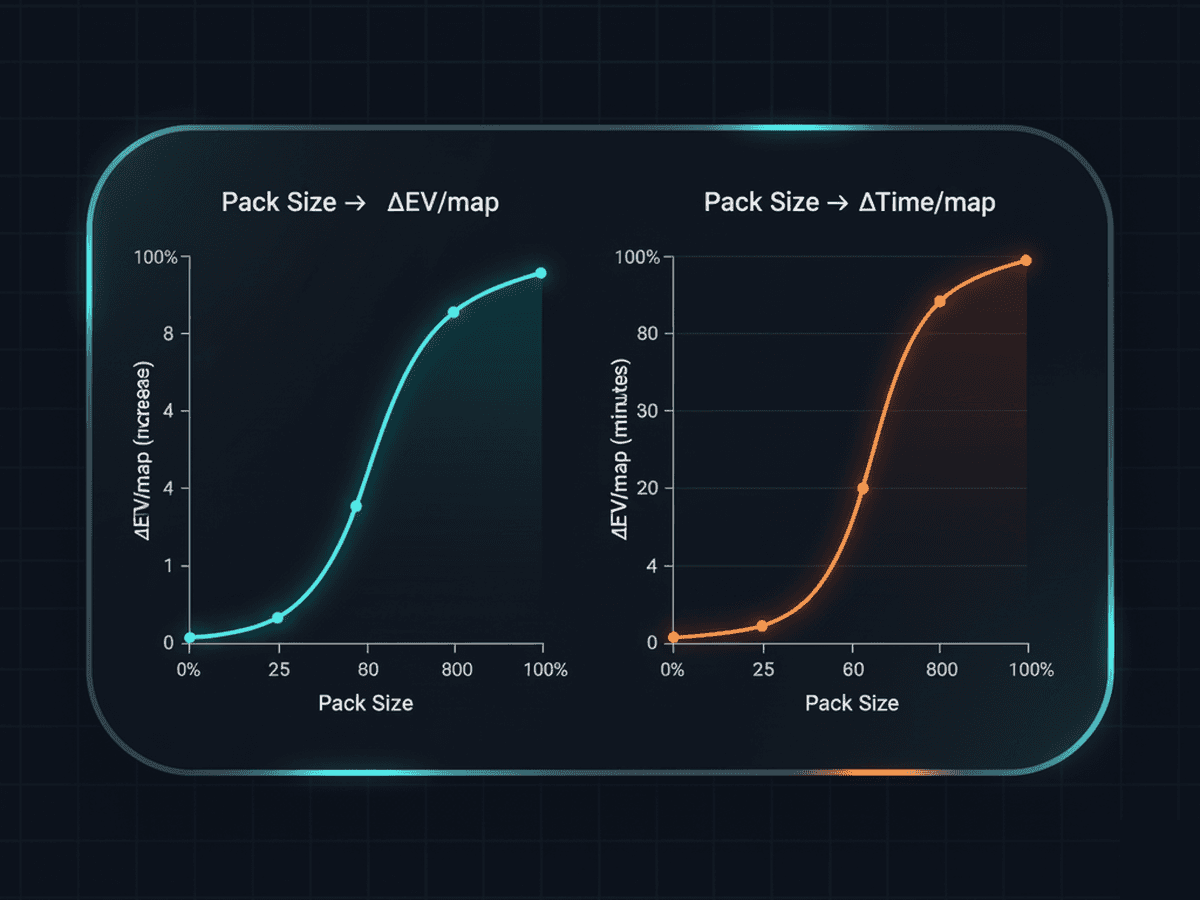
Pack size scaling & diminishing returns
Adding pack size increases monster count linearly, but the time-per-map may grow super-linearly if you're backtracking or waiting for spawns. The chart below illustrates this trade-off:
Benchmarks & realistic expectations
Early league mapping might yield 50-100c per hour with minimal investment, while heavily juiced T16 maps with scarabs and atlas passives can reach 300-500c per hour or more. Your actual returns depend on build speed, market prices, and drop luck.
League starters vs juiced endgame
League start focuses on consistent, low-investment strategies to build currency. Endgame juicing trades higher map costs for exponentially better returns when you have the capital to sustain it.
Favor currency density over RNG spikes
Reliable small drops (chaos, divine shards, essences) typically outperform rare big-ticket items over the long term. Build your strategy around steady income first.
Test window & sample size
Run at least 10-20 maps per configuration before comparing GPH. Small samples can mislead due to variance in divination card and unique drops.
Scarabs, Sextants & Atlas Passives — Weighted EV for Currency Profit
Treat add-ons with a weighted average model and make costs/time explicit. Some combos raise EV/map but slow you down so much that GPH is flat or worse.
Weighted average model for add-ons
Each scarab or sextant contributes a probability-weighted increase to your drop rates. The formula becomes: EV_total = EV_base + Σ (scarab_i_bonus × p_i) − costs. Time overhead must also be factored in.
When add-ons hurt your GPH
If a scarab adds 10% more EV but increases your map time by 20%, your GPH actually drops. Always compare the ratio: (EV_new / time_new) vs (EV_old / time_old).
Case examples & the "sweet spot"
A gilded scarab might add 15% more EV but cost 30c per map. Calculate whether the extra returns justify the investment by comparing total profit per hour, not just EV per map.
Scarab tiers & price snapshots
Scarab prices fluctuate daily. Use current market data from trade sites to ensure your profit calculations reflect real costs. Budget scarabs often provide better value than premium tiers for steady farming.
Sextant rotation & sustain math
Sextant charges last 3 uses, so divide their cost across three maps. Track which sextant mods boost your specific strategy most efficiently.
Atlas keystone caveats (mutual exclusion vs union)
Some atlas passives provide multiplicative bonuses that stack powerfully together, while others have diminishing returns or mutual exclusions. Test different combinations to find your optimal configuration.
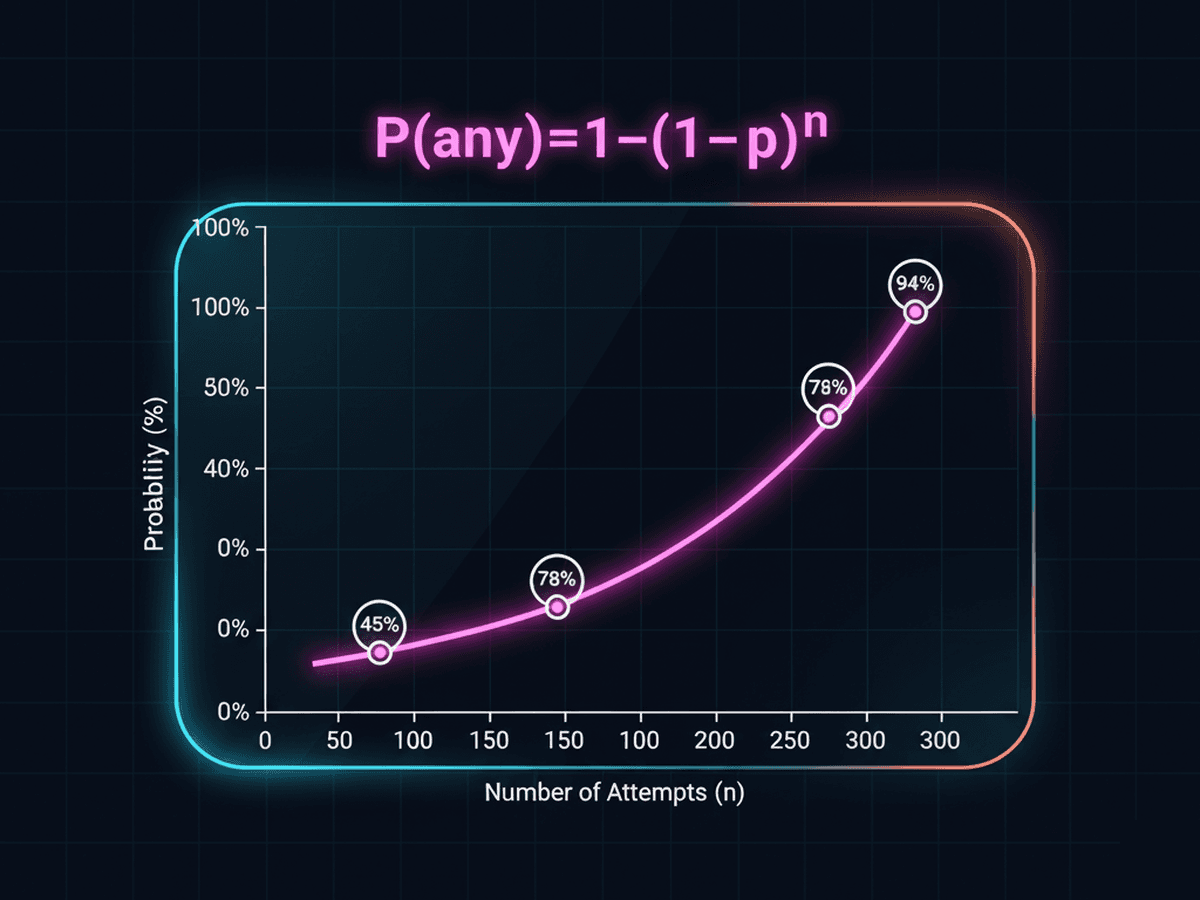
Union Probability & Divination Cards — P(any) for "At Least One" Drops
For target cards/rares, use P(any) = 1 − (1 − p)^n. Multiple sources (union): P(any of k) = 1 − Π (1 − p_i). Mutually exclusive tables: use additive probabilities that sum ≤ 1.
EV vs "luck windows"
Expected value tells you the average return over infinite runs, but P(any) tells you how likely you are to get at least one drop in a finite window. This is crucial for target farming divination cards or specific uniques.
Practical targets
If a card drops at 1% per map, you need ~69 maps for a 50% chance of seeing one, and ~138 maps for a 75% chance. Use P(any) to set realistic session goals.
Shareable configs for groups
Share calculator URLs with party members to coordinate strategies. Group play can split costs while maintaining high clear speeds, potentially boosting overall GPH for everyone.
Mixed-p maps & independence
When running different map types with varying drop rates, each map's probability remains independent. The union probability formula lets you calculate your overall chance across the entire session.
Don't double-count mutually exclusive tables
If a map can drop from Table A OR Table B but not both, use additive probabilities that sum to ≤ 1. Avoid multiplying probabilities for mutually exclusive outcomes.
Confidence intervals for your log
Track your actual results over time. If your observed GPH consistently differs from calculated values, check for missing costs, incorrect drop rates, or time estimation errors.
Costs, Price Sources & Assumptions (Methodology)
- Price feeds & manual overrides (with snapshot freshness).
- Time model: clearing + travel + resupply + trading.
- Known limitations: dependency between events; market volatility.
- Versioning & last update are shown in the UI footer.